
Behavior change strategy
Commuter behavior in Ahmedabad Traffic
BRIEF
-
The aim of this project was to study the behavior of commuters in traffic in the Indian context. For detailed research, various junctions in Ahmedabad were studied.
-
The project was divided into 2 phases, where -
-
Phase 1 catered to developing a broad understanding of traffic, its issues, consequences, traffic rules, statistics, change in behaviors based on regions, and legal implications.
-
For Phase 2, particular areas of intervention were precisely defined and studied.
-
This project elaborated below is focused on enhancing Traffic Experience and Awareness at Panjrapol Junction, Ahmedabad.
KEY LEARNINGS
Design Research
Behavior Analysis
Questionnaire Design
Conceptualization
RESEARCH TOOLS
Questionnaires
Personal Interview
Fly on the Wall
Word-Concept Assosciation
PHASE 1 - RESEARCH
Statistical Analysis:
Gathering a decade worth of information about the road traffic system and factors affecting it in the following areas:
-
Penalty structures
-
Traffic Management and authorities
-
Human behavior and experiences
-
Safety Guidelines
-
Rules and regulations
-
Awareness (education & training) and perspective of people towards traffic
-
Accidents and stakeholders
-
Type of commuters
-
Types of the vehicles
-
Type of the road
-
Types of the junctions
-
Types of the collisions
-
Archival Information Study
Reading books, research papers, articles, and drawing inferences about factors such as behavioral & Infrastructural impacts leading to traffic violation and overall scenario of traffic.
PRIMARY RESEARCH
-
Unstructured interviews followed by structured interviews in order to identify issues regarding traffic and also to gather the overall perception of people towards traffic
-
Designing Questionnaire -

-
Conducting Survey
-
Data Analysis
-
Drawing Inferences
-
Finding Insights
SECONDARY RESEARCH
-
The insights inferred from Phase I of the Design Project ‘Traffic’ were then communicated to the Traffic Department of Ahmedabad.
-
In a personal visit to the Commissioner of Police, Ahmedabad, a discussion regarding the issues identified by the department as well as the students regarding traffic was discussed.
-
A brief proposal was submitted by 3 groups of Strategic Design Management Batch, 2018.
-
The proposals were approved and 3 locations were allotted to the groups for their respective areas of study.
PHASE 2 - RESEARCH
The aim of Team Experience and Awareness was to improve the overall experience of commuters and spread awareness regarding traffic rules and regulations through interesting modes of engagement at Panjarpole Junction, Ahmedabad.
Traffic Police are an undeniably important part of the entire traffic system and hence the team also aimed to improve traffic-related experience for them through relevant design interventions.
SURVEY FINDINGS: AWARENESS
The findings of the survey regarding awareness of traffic rules and regulation shed light on the contradictions in the belief system of commuters around traffic and the reality of the traffic situation at present. Some of the interesting findings are -
83 % people claim they take traffic rules seriously.
-
91.3% people say they notice traffic violations very often.
-
Only 8.75% believe lack of knowledge of signages cause accidents.
58.8% people believe the rules can be made stricter.
-
But 64.69 % people are unaware of what the signages stand for.
-
Secondary data says 82.92% accidents occurred due to traffic violations.
(47%) people chose safety as their prior concern while driving a two-wheeler but on the other han
-
(95%combined) of people don’t associate following rules and regulation as safety.
81% people say that carrying a helmet just before driving is their priority
-
When asked for breaking which rule were they most likely to get caught, 42.4% claimed it would be for riding without wearing helmet.
SURVEY FINDINGS: EXPERIENCE
'Word-Concept Association' was used to find out about people's perception of the traffic system in India.
The research established that the first three things that came to mind on hearing the word "Traffic" were negative
Concerns
-
Accident
-
Cause Damage
-
Pollution
Movement of vehicles
-
Crowd
-
Congestion
-
Unorganized
-
Long queues of vehicles
-
Finding it difficult to move forward
-
To & fro hurried movements of all types of vehicles and commuters
-
Jammed Road, Traffic Jam
-
Block
-
Vehicles
-
Stop the Car
-
Road
-
Truck
Environment
-
Noise
-
Chaos
-
Horn
-
A lot of noise
-
Beep
Constraints
-
Time
-
Time Waste
-
Delay
-
Hectic
-
Fed Up
-
Late
Infrastructure
-
Signals
-
Traffic lights
-
Missing the traffic lights
-
Green
-
Street Lights
Health
-
Headache
-
Boredom
-
Tension
-
"On...no!"
-
Heat
-
Suffocation
-
"Ahhhh!"
STAKEHOLDERS

USER JOURNEY MAPPING


SCOPE OF INTERVENTION

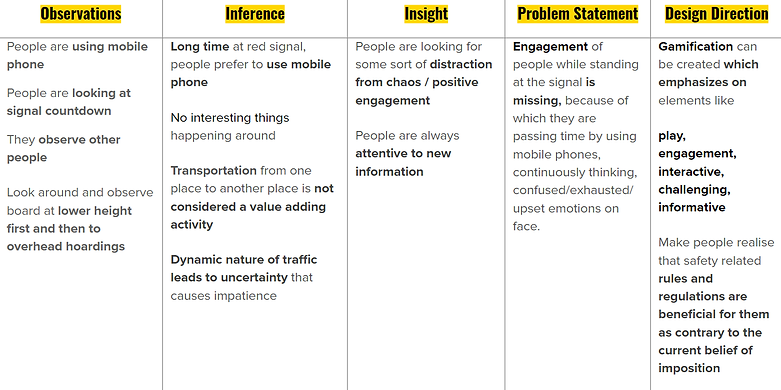
RESEARCH ANALYSIS: ENGAGEMENT & AWARENESS
DESIGN DIRECTION: ENGAGEMENT & AWARENESS
1. Involve commuters at the signal with an interactive screen
Engage them with -
-
Quiz
-
Awareness Signages
-
Quotations
-
Live Streaming of the camera footage of the same junction
The screen time will be divided as per the duration of signal time between different elements shown on the screen.


Quiz:
The duration of the number of questions asked will be dependent on the duration of that particular signal.
-
Quiz questions will be of 3 types :
-
Multiple Choice Questions
-
Yes or No
-
True or False
-
-
The time duration for which each question will be displayed will be approximately 11 sec.
-
Screen time for various elements will depend upon the traffic signal at the intersection for a particular lane.

Awareness Signages:
Traffic Signages will be displayed to create awareness about the traffic rules amongst the commuters

Quotations and Statistics:
To create awareness amongst the commuters in a funny, interactive and witty way.
2. Live streaming of the camera footage of the respective junction
The LED display will stream live footage of the traffic in that particular intersection. The aim of the live streaming is to make people aware about the traffic violators and acknowledge compliant commuters. In the advanced stage, people violating the rules can be highlighted and fined, where as people/lanes showing compliance will be acknowledged.

RESEARCH ANALYSIS: EXPERIENCE

DESIGN DIRECTION: EXPERIENCE
A solar panel shade structure with built-in signals and timers
Providing a shade structure can help address the issue of flocking of vehicles in certain areas and will also help reduce the agitation in commuters due to heat. A series of solar panels can be installed to create shade, thus converting the disadvantage into advantage. Solar energy can be converted to electrical energy which will be transmitted to all nearby signals and BRTS stations.
Our research established that commuters tried to fit in their vehicles in awkward spaces, causing inconvenience for themselves as well as the other commuters at the junction, only to have the signal in their vision. The design direction suggests, signals and timers to be built in the inner corridor of the shade, thus calming the anxiety of commuters to look at the signal while providing a comfortable physical environment.


OTHER DESIGN DIRECTIONS
1. Lane Compliance - Designated lanes for 2-wheeler & 4-wheeler
Two dotted lines (on the lane) allow free space for the commuters to overtake. Two-wheelers change lanes more frequently. Most side collisions occur due to overtaking.


2. Lane Compliance - Pictogram & Pointer (Gamification)
A pictogram on the road can work as a nudge. A small pointer can be installed on car bonnets and bikes that will act as a guide to follow a colored, highlighted single line road marking.

